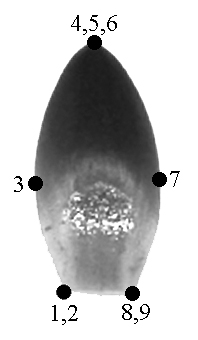
A – typical sepal
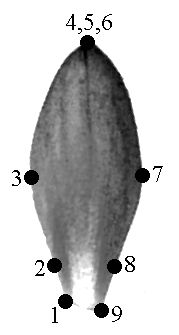
B – typical petal
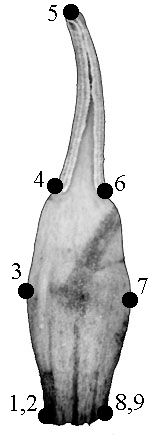
C – typical stamen
Background and aims. The classical example of petal-to-stamen transition is flower of white water-lily (Nymphaea alba s.l., Nymphaeaceae). The description in terms of classical plant morphology can not reveal all morphological variation of transitional organs. Our aim was to describe transitional structures of Nymphaea flower using integral approaches, which could adequately reflect the nature of transitional structures.
Methods. We have collected 25 water-lily flowers from four regions of European Russia. All the organs of the flowers were measured (2479 organs totally). Our data were analysed graphically and by various methods of multivariate statistics. To reduce the influence of size we computed two integral “hybrid” morphological indexes. The Euclidean distances from “typical stamen” and membership coefficients of fuzzy clustering were also calculated. In addition, we have tested the descriptive ability of landmark-based geometric morphometrics.
Key Results. Besides traditional petal-to-stamen transition, in Nymphaea flower we have documented intermediate organs between sepals and petals, which are close to sepals by their morphology. Traditionally gradual petal-to-stamen shift was postulated for Nymphaea flower. In the spite of this postulation, our application of computing Euclidean distances method, of “hybrid” indexes and of cluster membership of fuzzy clustering revealed that petals, stamens and transitional structures could be efficiently separated by their characters. The analysis of these characters shows diversity in morphology of flowers, collected from distinct regions of European Russia, which could be of taxonomical importance. It is remarkable, that different morphological feature shifts, leading to substitution of sepals by petals and of petals by stamens, occur asynchronously.
Conclusions. Flowers could be investigated as certain “populations”, where any separate organ represents a single “individual”. Thus methods, used in plant population biology, may be applied to flower organs. Morphological nature of these organs is better revealed via integral characteristics such as “hybrid” indexes, distances and cluster membership.
The concept of “iron triad” is the most widespread in plant morphology. According to this paradigm, all the variety of flowering plant organs could be referred to as one of three main organ types: root, stem or leaf. Following W. Goethe’s foliar theory (Arber, 1946), flower organs are metamorphosed leaves (phylloms). This concept was placed in the cornerstone of the ABC-model of genetic regulation of flower organ type (Coen and Meyerowitz, 1991). The ABC-model postulates vegetative leaf to be the “initial state” of organ, whereas the appendicular organs of flower develop due to activation of genetic functions of A, B, and/or C gene groups. These changes in gene expression pattern cause certain modifications in program of phyllom development and the initial “vegetative leaf” appeared to be metamorphosed to the corresponding flower organ. All the variety of organs in this model is restricted to (1) vegetative leaves, (2) sepals, (3) petals, (4) stamens and (5) carpels. Thus, a priori assumption of the existence of distinct organ types in the flower is widespread in modern botany (Timonin, 2002). It is accepted that one can definitely classify every flower structure to one of the five mentioned types, the “merons” sensu Meyen (1973).
However, in flowering plants sometimes we find the organs with enormous morphology, intermediate between traditional merons. These transitional structures appear both in vegetative and generative spheres. For instance, “phylloclades” of Asparagaceae, shoot-like organs of Utricularia (Lentibulariaceae) and phyllomorphes of Streptocarpus (Gesneriaceae) possess morphological characters of both axes and leaves (Timonin, 2002). The classical example of petal-to-stamen transition is the flower of water-lily (Nymphaea, Nymphaeaceae). The structures with partly androecial and partly perianth characters are described already in Goethe’s “Plant Metamorphosis” (Arber, 1946). The white water-lily (N. alba L. s.l.) is widespread in Europe; it is regarded as a species with gradual transition from petals to stamens (Heslop-Harrison, 1955; Dubyhna, 1982).
Nymphaea alba has large solitary androgynous flowers with double perianth and long peduncle. The outer perianth whorl(s) is composed of three to seven (usually four) sepals. The abaxial side of sepal is green, and the adaxial one is greenish-white. Numerous (“many”) petals are white. Inwards to the typical petals is placed the transitional region of the flower (intermediate organs with combined androecial and corolla characters). We avoid the term “staminode” because of its morphological uncertainty (see Walker-Larsen and Harder, 2000). Stamens are numerous, more or less spirally arranged; they have a long connective and anthers submerged in the sterile tissue. Gynoecium consists of 5–35 laterally connate carpels with sessile stigma (Heslop-Harrison, 1955; Moseley, 1961; Schneider et al., 2003). The level of transition between petals and stamens is assumed as an important diagnostic character in Nymphaea taxonomy (Uotilla, 2000). However, there was no attempt of quantitative estimation of character transgression in water-lily flower. Several botanists accept that description of transitional structures from the viewpoint of classical morphology cannot cover all their variability (Sattler, 1996; Timonin, 2002). Consequently, we decided to find other tools that are adequate for the exact definition of these structures.
Dynamic, or continuum morphology suggested by R. Sattler (1966) is one of appropriate approaches. The main idea of dynamic morphology is the substitution of rigid system of organ types by quantitative estimation (for example, scores) of the character expression. This approach exactly corresponds to method of “hybrid” indexes that was suggested for investigations of introgression by E. Anderson in 1949 (Wilson, 1992). Different methods of computation the similarity between individual plants are even more abundant in taxonomy than “hybrid” indexes (Wilson, 1992; Sattler and Rutishauser, 1997). These methods are usually based on computations of different types of distances and/or principal component analysis (Sattler and Jeune, 1992; Lacroix et al., 2003).
The methods of dynamic morphology were repeatedly used by morphologists to study transitions between different types of vegetative organs (Sattler, 1996; Lacroix et al., 2003) whereas the dynamical morphological investigation of transitional flower structures has not yet been made (Rutishauser, 1989). Furthermore, this methodology is of the great interest in the light of the ABC-model of flower development. Thus, the aim of this paper is to describe the transitional structures of Nymphaea flower using approaches that are in chime with dynamic morphology of plants.
We investigated flowers of Nymphaea alba L. sensu lato (including often recognized as separate species N. candida J. Presl; see Uotilla, 2000) from four regions of European Russia: southern Kaluga region (3 flowers), Tver’(13), Chelyabinsk region (2), and northern North Karelia region (7). All the material was collected in Jun.–Sep. 2004. In total, 2479 flower organs were analysed. We recorded all main morphological characters for all organs of each specimen, removing organs consequently from periphery to the centre of flower. Both qualitative and quantitative characters were recorded (Table 1). Some of them (primary) were measured; the remaining (secondary) characters were calculated from primary ones. The distal part of stamen, bearing anthers, and geometrically separated distal part of the transitional organ were treated equally.
|
Abbreviation |
Description |
|
N.ORG |
number of organ (counted from periphery to centre) |
|
LN |
length (from base to top), in millimetres |
|
WD |
maximal width, in millimetres |
|
POS |
the position of maximal width (from the base), in millimetres |
|
LN.TH |
the length of anthers (or the length of topmost narrow part of organ), in millimetres |
|
ANGLE |
the angle between thecae (0 anthers are absent, 1 thecae are nearly parallel, 2 thecae form the sharp angle, 3 thecae form right or obtuse angle) |
|
COLOR |
the colour (9 different colours are coded as the relative hue degree from HSB colour model) |
|
VIS |
the visually attributed type of organ (petal, tr1, sepal, tr2, stamen; where “tr” are transitional organs) |
|
rel.ln |
the ratio of maximum organ length to maximum width |
|
th.ln |
anthers length to maximum length of the organ ratio |
|
pos.ln |
the location of maximal width (measured from the base of the organ) |
|
color.n |
the colour code: the “G” (green) component of the RGB colour scale |
For every flower we created virtual morphological characteristics of “typical stamen”, calculating the median values for all the analyzed stamen characteristics. After this step the degree of dissimilarity for each organ could be referred to the “zero point” of the “typical stamen”: we calculated it as multidimensional Euclidean distance between characters of the given organ and of the “typical stamen”. Then median values for all the stamens and petals from all the flowers were used as starting points for the calculations of the “cluster membership” in fuzzy clusterisation. This method is widely used in multivariate data analysis and solves the problems of including (or excluding) the given object in the certain class (Kaufman and Rousseeuw, 1990). We used the value of cluster membership in the cluster of “typical stamens”.
Similarly to well-known “hybrid indexes”, we have proposed two integral morphological indexes: each organ was characterized by two scores from one to ten (Table 2): (1) by “Index A”, in which the first score corresponded to typical sepal and tenth score to the typical stamen and (2) by “Index B” where the first score corresponded to typical petal and tenth—to the typical stamen (sepals and transition organs between sepals and petals were ignored in this case). The Index A does not contain maximum width location because the value of this character for sepals is between petals and stamens (Table 3). We compute the score of each index as arithmetical mean between scores for all morphological characters (Table 4).
|
character |
Index A |
Index B |
||
|
character values |
score |
character values |
score |
|
|
ANGLE |
anthers are lacking |
1 |
anthers are lacking |
1 |
|
have acute angle between them |
7.5 |
have acute angle between them |
5 |
|
|
almost parallel to each other |
10 |
almost parallel to each other |
10 |
|
|
organ colour |
brown |
1 |
… |
… |
|
greenish-brown |
2 |
… |
… |
|
|
green |
3 |
… |
… |
|
|
whitish-green |
4 |
whitish-green |
1 |
|
|
white |
5 |
white |
2 |
|
|
light yellow |
7 |
light yellow |
5 |
|
|
dirty-yellow |
8 |
dirty-yellow |
6 |
|
|
yellow |
9 |
yellow |
8 |
|
|
yellowish-orange |
10 |
yellowish-orange |
10 |
|
|
rel.ln |
[1.4; 3] |
1 |
[1.4; 2.4] |
1 |
|
(3; 4] |
6 |
(2.4; 3.2] |
3 |
|
|
(4; 5] |
7.5 |
(3.2; 5.0] |
5 |
|
|
(5; 6] |
8.5 |
(5.0; 10.0] |
7 |
|
|
(6; 22] |
10 |
(10.0; 22.0] |
10 |
|
|
th.ln |
0 |
1 |
0 |
1 |
|
(0; 0.1] |
6 |
(0; 0.2] |
3 |
|
|
(0.1; 0.25] |
7.5 |
(0,2; 0,3] |
5 |
|
|
(0.25; 0.4] |
8.5 |
(0.3; 0.4] |
7 |
|
|
(0.4; 0.7] |
10 |
(0.4; 0.7] |
10 |
|
|
pos.ln |
… |
… |
(0.6; 0.9] |
1 |
|
(0.4; 0.6] |
3 |
|||
|
(0.3; 0.4] |
5 |
|||
|
(0.1; 0.3] |
7 |
|||
|
[0; 0.1] |
10 |
|||
|
Organ |
LN |
WD |
POS |
LN.TH |
ANGLE |
rel.ln |
th.ln |
pos.ln |
color.n |
|
pet |
25-59 |
10-29 |
13-36 |
0-0 |
0-0 |
2.7-2.7 |
0.0-0.0 |
0.4-0.7 |
0.00-0.00 |
|
spl |
39-62 |
19-31 |
16-31 |
0-0 |
0-0 |
1.7-2.6 |
0.0-0.0 |
0.4-0.6 |
0.07-0.32 |
|
sta |
13-28 |
1-5 |
0-9 |
5-11 |
1-2 |
4.0-15.7 |
0.3-0.5 |
0.0-0.5 |
0.13-0.18 |
|
tr1 |
40-61 |
21-32 |
21-35 |
0-0 |
0-0 |
1.8-2.6 |
0.0-0.0 |
0.5-0.6 |
0.28-0.32 |
|
tr2 |
19-30 |
4-10 |
5-14 |
0-12 |
0-2 |
2.5-6.6 |
0.0-0.4 |
0.2-0.6 |
0.00-0.16 |
|
Organ |
Index A |
Index B |
|
pet |
2.0-2.0 |
... |
|
spl |
1.0-1.5 |
1.2-2.0 |
|
sta |
8.1-9.3 |
5.4-9.0 |
|
tr1 |
1.5-1.8 |
... |
|
tr2 |
3.3-9.0 |
1.0-2.8 |
Geometric morphometrics (referred hereafter as GM) helps to avoid the influence of organ size on our understanding of organ shape. This method examines the organ shape as a whole, without reference to the size (Bookstein, 1991; Adams et al., 2002). The most widespread methods of GM (e.g., thin plate splines analysis, TPS; or generalized least-squares orthogonal Procrustes analysis, GLS) use so-called “landmarks” as key points of the investigated contour. These landmarks should be homologous at least geometrically, because TPS and GLS manipulate exclusively with landmark coordinates, and the differences between objects should be comparative. TPS computes the bending energy required for fitting landmarks from one specimen to another, whereas Procrustes distance is the square root of the sums of squared distances between two centred, normalized and optimally rotated configurations of landmarks. Thus, the last measure is analogous to the Euclidean distance and comparable with other widely used indexes of dissimilarity (Pavlinov, 2001).
We outlined each of 73 organs of flower #35 to test the possibility of applying GM methods. Nine landmarks were used for describing the shape of each organ. We used not only biological but also geometrical reasons for locating the landmarks: they were located in the points of maximum contour curvature (Fig. 1, a–c). The landmarks coordinates were revealed via tpsDig software (Rohlf, 2004a); Procrustes distances were computed with tpsSpline (Rohlf, 2004b).
|
A – typical sepal |
B – typical petal |
C – typical stamen |
|
|
|
The cubic spline smoothing was used for plotting of “mutation curves” which show the speed of alteration between different organ types. This method is the most appropriate while curves configuration is complex. All uni- and multivariate computations were performed in R (v.2.0.1 for Windows) statistical environment (R Development Core Team, 2004).
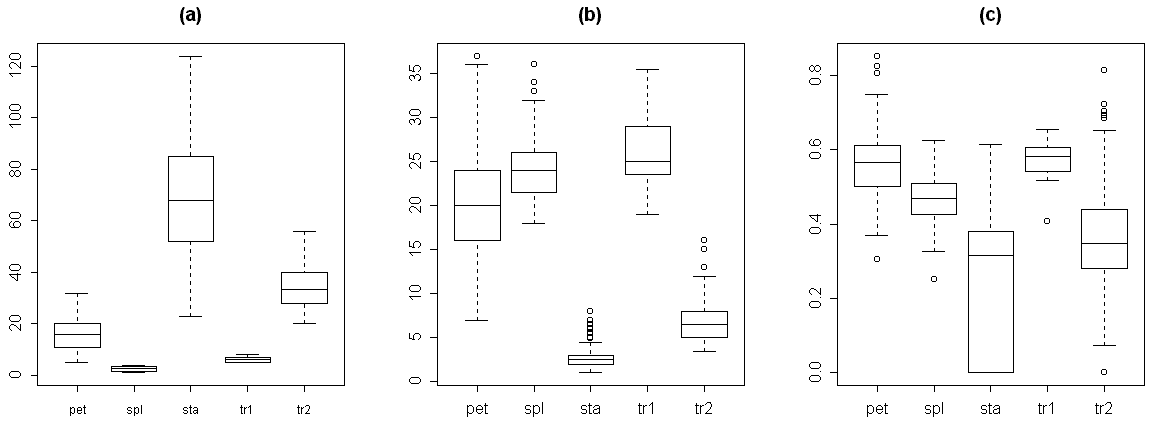
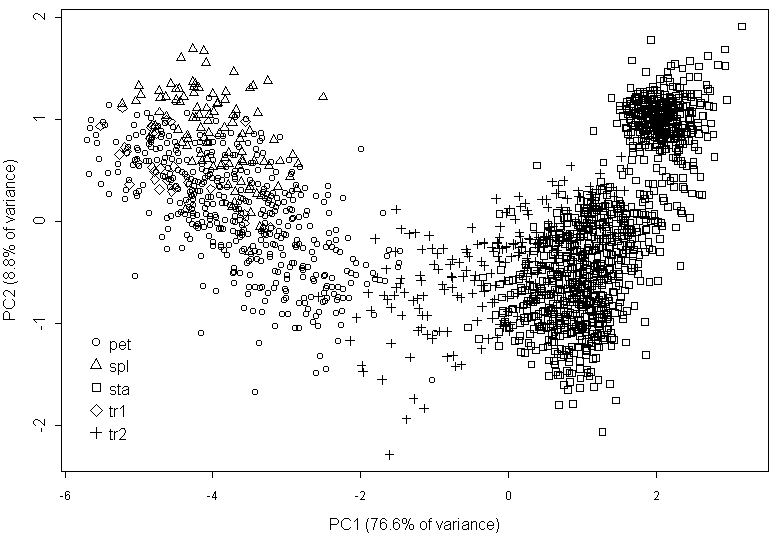
For the reason of making easier further measurements, we classified each organ as one of five types: 1) sepals, 2) transition from sepal to petal, 3) petals, 4) transition from petal to stamen and 5) stamens. This preliminary classification was based on the visual characteristics. For the transitive organs we used the following criteria. The second type (transition from sepal to petal) differs from sepals by presence of chlorophyll band on the distal part of the abaxial side. Typical morphological characteristics of each organ type are shown in Table 3. As a rule, these organs have more or less specific location in the flower (Fig. 2, a). The visual classification (based on the classical morphological approach) appeared not to be perfect, because we found many intermediate structures even between five mentioned types. The next two box plots (Fig. 2, b–c) show that characteristics of organ types significantly overlap both for absolute (e.g., the width of organ) and for relative characters (e.g., the ratio between the length of organ and the relative position of maximal width).
The multivariate analysis (PCA) of most characters returns the graph where many points have not the unequivocal position (Fig. 3). The sepal-to-petal transitions are morphologically close to sepals. The linear discriminant analysis shows that mean misclassification error is relatively high (26.7%) and even more (31.3%) for petal-to-stamen transitions; 26% of petal-to-stamen transitions were erroneously classified as stamens, and 2% of stamens—as transitional organs.
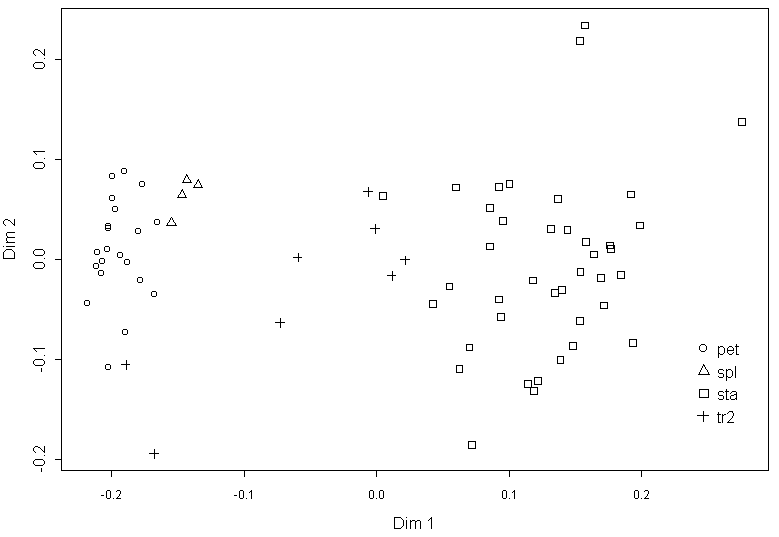
The Procrustes distance matrix (the GM analysis of contours) and Euclidean distance matrix between organs of flower #35 (classical morphological data) are highly correlated (Mantel test r=0.77, p<0.01). The multidimensional scaling of GM data shows that organ types separated more clearly than in the analysis of classical morphological data, without significant overlap (Fig. 4), but gaps between “clouds” of points are narrow. The first dimension in this graph could be useful as a character for a dynamic analysis, but GM is extremely sensitive for sampling (Pavlinov, 2001) that makes the results of the different GM analyses incomparable.
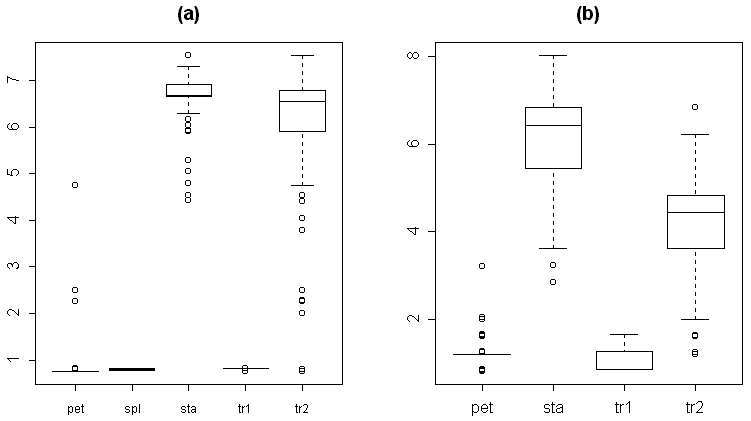
The integral “hybrid” indexes show continuous bimodal distribution with two peaks each. These indexes appeared to be better for characterization of all organ types (Table 4 and Fig. 5), but they are more valuable for subsequent dynamic analysis.
For the changes in distinct characters we used the smoothed splines (“mutation curves”). Surprisingly, that the first extremes of different curves fall on diverse regions of the flower, and the relation between curvature and organ type appeared not to be so obvious (Fig. 6, a-b). For example, in the transitional region between petals and stamens the curve extreme for the organ width falls either to the transition organs between petal and stamen, or it is not expressed (Fig. 6, a), the curve extreme for position of maximal width falls either on stamens, or on the transitional organs (Fig. 6, b). Thus, the different morphological characters have different “behaviour” (e.g., change asynchronously) and do not able to represent the whole flower structure. Euclidean distance between the current organ and the “typical stamen” slightly increases during the transition from sepals to petals, and essentially decreases during the transition from petals to stamens, asymptotically reaching 1 (Fig. 6, c). The extremes of this curve not always correspond with the alternation from one organ type to another.
The mutation curve of cluster membership in the cluster of “typical stamens” shows the maximal increase in the region of transitional organs, whereas the first kink corresponds to the basal border of the androecial region (Fig. 6, d). The curves of sampled flowers #26 and #34 are closer in this case, which demonstrates the better quality of cluster membership for comparing organs in different flowers. The curve for Index A has relatively simple shape with clear extremes that correspond to organ types alternations (Fig. 6, e). Values of the index increase fluently and the most saltatory area corresponds with the transitional organs between petals and stamens. For some flowers, this part of the graph looks almost like vertical line (not shown). The mutation curve for Index B illustrates the process of transition from petals to stamens in other manner (Fig. 6, f).
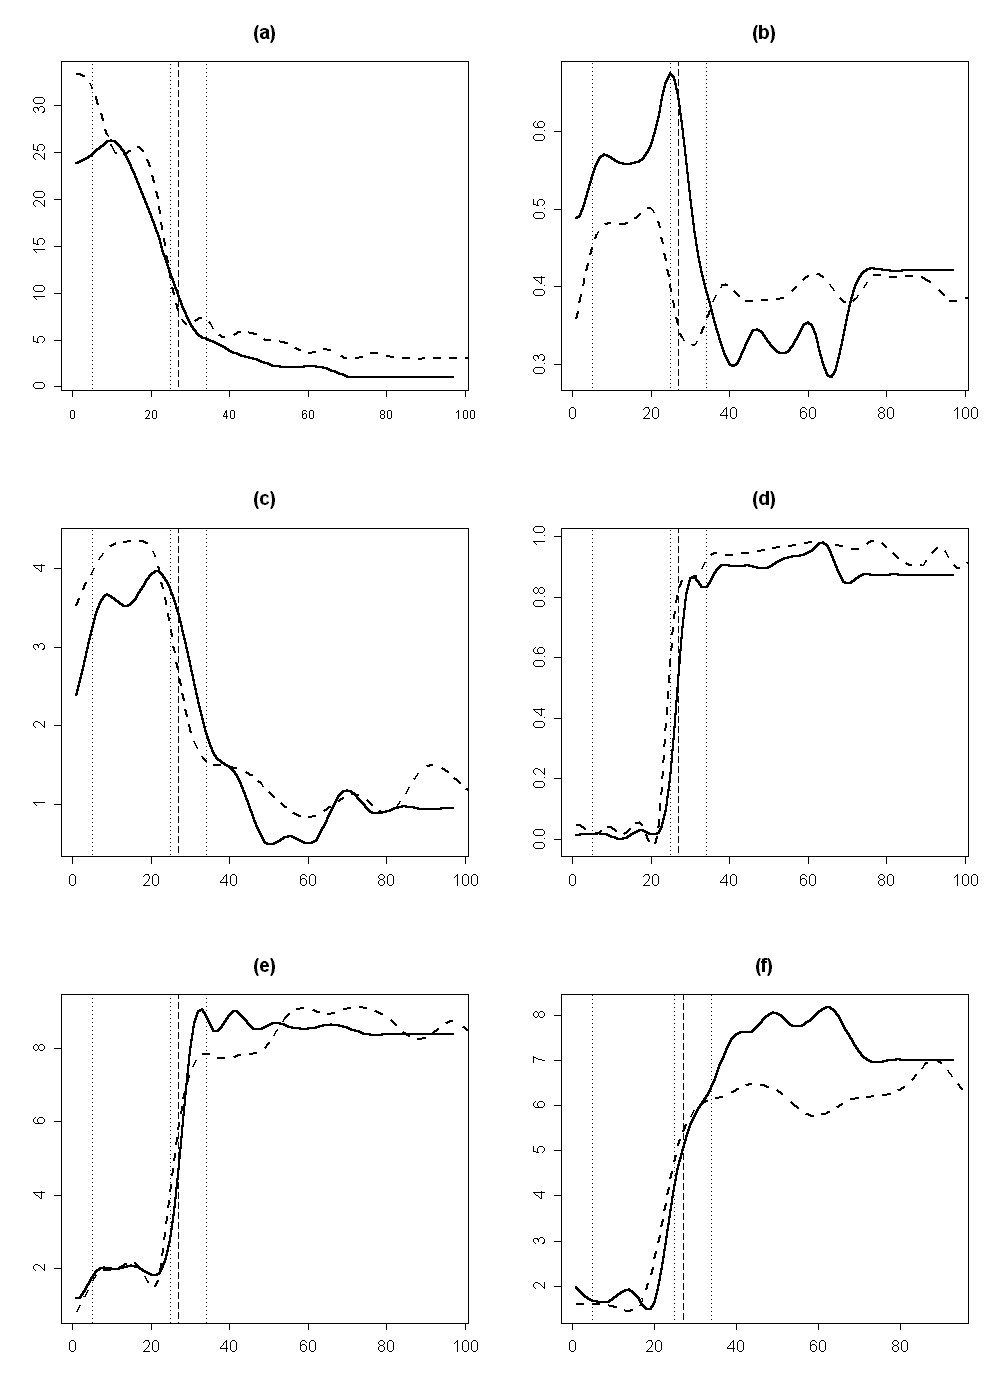
The vertical lines represent borders between different organ types: two first (from left to right) dotted lines—from sepals to petals and from petals to petal-to-stamen transitions, respectively; the third dotted line and the dashed line—the border between petal-to-stamen transitions and stamens for flower #35 (the third dotted line) and #26 (the dashed line).
The investigation of dynamic features of flowers let us to emphasize the difference between flowers from different regions of Russia. In some Northern populations we found that stamens are more similar to petals, than stamens of flowers from other populations of N. alba s.l. The flowers from Karelia are characterized by maximal width located almost in the middle of organ (near the base in flowers from other populations); the length of organ 4–6 times exceeded the width (7–11 for other populations) and the acute angle between anthers (nearly parallel in other populations). The proportion of transitional organs between sepals and stamens is quite different for these groups: 0–4% for Karelian population and 8–18% for southern ones.
As a whole, we used six different approaches to characterize the organs of Nymphaea flower: (1) the visual classification; (2) PCA ordination for the primary and secondary morphological characters; (3) multidimensional scaling for matrix of Procrustes distances, revealed by GM; (4) “hybrid” indexes A and B; (5) the membership in the cluster of “typical stamens”, revealed by fuzzy clusterisation and (6) the Euclidean distances between each organ and “typical stamen” of each flower. The approaches 2–6 are based on the view that flowers (and other parts of plant) could be investigated as particular “populations”, where organs could be referred to as “individuals”. This viewpoint was justified in the investigations of other (mostly vegetative) plant organs (Sattler and Jeune, 1992; Lacroix et al., 2003).
The comparison of the traditional visual classification of Nymphaea organs and of classification based on the morphology performed by PCA (Fig. 3) revealed differences between these classifications for stamens and petal-to-stamen transitive organs. In the contrast, the similarity of the results, obtained by methods of classical and geometrical morphometry, shows that morphological indexes can characterize the shape of Nymphaea flower organs as effective as GM does.
The presence of transitional organs between sepals and petals in the Nymphaea flower, besides the existence of petal-to-stamen transitions, is our novel morphological observation. These organs appeared to be widespread among the specimens from Tver’ region. There are also other differences between flowers from distinct regions. As an example, the stamens of northern Karelia Nymphaea have some morphological features that are typical for the petal-to-stamen transitive organs (Table 3); the proportions of transitional organs in the flower are also different. These characteristics could be of the taxonomical importance, because most of authors accept at least two different species on the territory of European Russia: Nymphaea alba and N. tetragona Georgi. However, the present taxonomic uncertainty in European water-lilies taxonomy (Uotilla, 2000) does not let us to relate the observed features to species description.
The analysis of “mutation curves” for every individual morphological character shows that some of them (e.g., organ width) could not be used for matching between organs and organ types. The metrics from PCA (e.g., the value of PC1) or from GM (e.g., the value of the first dimension from multidimensional scaling of Procrustes distances) are also not sufficient, because they are strictly depending on the initial set of organs (this is especially significant for any type of GM analysis).
Correspondingly, the classical morphology is not a perfect appropriate method for exact characterising the petal-to-stamen transition: i.e. we should use some integral characteristic, such as the “hybrid indexes”, cluster membership from fuzzy clusterisation and Euclidean distances, which have better “resolution” for adequate characterization of these transitions. Thus our results on Nymphaea flower confirm the idea of dynamic morphology, used in previous investigations on vegetative organ transitions (Sattler, 1966; Sattler and Jeune, 1992; Sattler, 1996; Sattler and Rutishauser, 1997; Lacroix et al., 2003). According to the Fig. 6, the best approaches are cluster membership and Index A, which demonstrates the good accordance between organ type and corresponding index. Taken as a whole, different dynamic morphological approaches are the effective methods for investigation of transitional generative structures of flowering plants.
The methods described could be also efficiently used for the precise examination of various transitional structures both in morphology, teratology and in genetics. For example, in Cactaceae flowers the features of sepals (or even of vegetative leaves), typical for the basal organs, are gradually shifted to petal characters in the upper part of perianth region (Barthlott and Hunt, 1993). The proposed methods let us judge more precisely about the morphological nature of problematic organs, and solve terminological difficulties in the case of existence more than four classical organ types.
Plant geneticists are faced a problem of mutant phenotype description. Often the classic morphology gives no tool for its exact solution. The resulted description appeared to be inaccurate and simplified, leading to missing in character analysis. For example, transitions between leaves and leaf-like organs carrying stigmatic tissue and ovules are described for mutant apetala2 in model plant Arabidopsis thaliana (L.) Heyn. (Bowman et al., 1989). Compound leaf of tomato with broken expression of LeT6-gene (homeobox-containing gene of class I) gains features of axial structures (Janssen et al., 1998). For the reason of complex precise description we suggest the methods of dynamic morphology and Euclidean distance computing for broad application in genetics to analyze the transitional structures of mutant plants.
According to the wide spread ABC-model of flower development, differentiation of petals and stamens is caused by expression of B-group genes. Petals are initiated in the space with cotemporary expression of genes from A and B class, and stamens appear in the region with overlapping expression of genes from B and C class (Coen and Meyerowitz, 1991; Soltis et al., 2002). Thus, substitution of petals by stamens is caused by substitution of expressed genes. According to the ABC-model, the expression of each gene class occurs in definitely outlined domains, what causes differentiation of sharply bordered regions of calyx, corolla, androecium and gynoecium on the floral primordium. In this case, it would be adequate to describe the structure of the flower by the means of classical typological approach.
Currently the orthologs of АВС-genes for Nymphaea are poorly characterized (Soltis et al., 2002). In Nymphaea flower the morphology of the organs changes gradually, i.e. we can suppose that borders between zones of gene expression are not well-pronounced. The border between androecium and petals is determined by configuration of expression zones of A and C class genes (Coen and Meyerowitz, 1991). Obviously, there are zones in Nymphaea flower, where gene activity of both A and C classes could be hypothesized, and the dynamic approach is more appropriate for the description of these organs. It is noticeable that the characteristic points of remarkable changes of morphology in the space of the flower are seldom coincided for different features. If we suppose that all the investigated morphological features of Nymphaea flower are controlled by the АВС-system, we should accept the existence of critical levels of gene expression, influencing on each organ feature separately. This hypothesis can explain the non-synchronic changes of different morphological characters toward the flower centre (Fig. 6). It is possible that in other taxa changes of expressed gene classes in flower development are also not so sharp as it is supposed by the ABC-model or/and are controlled by supplementary genes, not included to the АВС-model.
The dilemma of the most appropriate approach in plant morphology (typological or dynamic) is not resolved by now (Sattler, 1966; Sattler and Rutishauser, 1997; Timonin, 2002). The main objection against the dynamic morphology is the necessity of choosing the typical pattern of particular character expression to develop the scale for organ comparison. The initial patterns for the indexed scale are the meron features revealed by typological approach (Timonin, 2002). However, we can consider morphological characters of extreme morphotypes between which transition exists, as a pattern of particular character expression. Let us imagine merons as these extreme morphotypes (because these morphotypes are merons), and the differences between classical and dynamic morphology disappear. Even when one rejects the existence of transitional forms between merons, typological and dynamic morphology will stay complementary and coexistent approaches (Sattler, 1996).
Most of our data were gathered during summer field practices of Biological Department of Moscow South-West High School (headed by Dr. S.M. Glagolev). We thank O. Aleksandrova, E. Altshuler, N. Blohina, E. Chervyachkova, A. Glagolev, O. Kudina, N. Kulyhgina, D. Mordvinkin and N. Velichanskaya for help in data collection.
Adams D.C., Rohlf F.J., Slice D.E. 2002. Geometric morphometrics: ten years of progress following the "revolution". Ecology and Evolution, SUNY, Stony Brook.
Arber A. 1946. Goethe’s botany. The meta-morphosis of plants (1790) and Tobler’s Ode to Nature (1782) with an introduction and translation by Agnes Arber. Chronica Botanica 10: 66–124.
Barthlott W., Hunt D.R. 1993. Cactaceae. Pp. 161-196, in Kubitzki, K., Rohwer, J. G., & Bittrich, V. (eds.), The families and genera of vascular plants. II. Flowering plants: Dicotyledons, Magnoliid, Hamamelid and Caryophyllid Families. Springer, Berlin.
Bookstein F.L. 1991. Morphometric tools for landmarks data. New York: Cambridge Univ. Press.
Bowman J.L., Smyth D.R., Meyerowitz E.M. 1989. Genes directing flower development in Arabidopsis. Plant Cell 1: 37–52.
Coen E., Meyerowitz E.M. 1991. The war of the whorls: genetic interactions flower development. Nature 353: 31–37.
Dubyhna D.V. 1982. Nymphaeaceae of the Ukraine [in Russian]. Kiev: Naukova Dumka.
Heslop-Harrison J. 1955. Nymphaea. Journal of Ecology 43: 719–734.
Janssen B-J., Lund L., Sinha N. 1998. Overexpression of a homeobox gene, LeT6, reveals indeterminate features in the tomato compound leaf. Plant Physiology 117: 771–786.
Kaufman L., Rousseeuw P.J.1990. Finding groups in data: An introduction to cluster analysis. Wiley, New York.
Lacroix C., Jeune B., Purcell-MacDonald S. 2003. Shoot and compound leaf comparisons in eudicots: dynamic morphology as an alternative approach. Botanical Journal of Linnean Society 143: 219–230.
Meyen S.V. 1973. Plant morphology in its nomothetical aspects. Botanical Reviews 39: 205–260.
Moseley M.F. 1961.Morphological studies of the Nymphaeaceae II. The flower of Nymphaea. Botanical Gazette 122: 233–259.
Pavlinov I.Y. 2001. Geometric morphometrics, a new analytical approach to comparison of digitized images. In: Information technology in biodiversity research: Abstracts of the 2nd international symposium. St. Petersburg: Russian Academy of Science, 44–64.
R Development Core Team. 2004. R: A language and environment for statistical computing. R Foundation for Statistical Computing, Vienna.
Rohlf F.J. 2004a. tpsDig. Version 1.40. Department of Ecology and Evolution, State University of New York at Stony Brook.
Rohlf F.J. 2004b. tpsSpline, thin-plate spline, version 1.19. Department of Ecology and Evolution, State University of New York at Stony Brook.
Rutishauser R. 1989. A dynamic multidisciplinary approach to floral morphology. Progress in Botany 51: 54-69.
Sattler R. 1966. Towards a more adequate approach to a comparative morphology. Phytomorphology 16: 417–429.
Sattler R., Jeune B. 1992. Multivariate analysis confirms the continuum view of plant form. Annals of Botany 69: 249–262.
Sattler R. 1996. Classical morphology and continuum morphology: opposition and continuum. Annals of Botany 78: 577–581.
Sattler R., Rutishauser R. 1997. The fundamental relevance of morphology and morphogenesis to plant research. Annals of Botany 80: 571–582.
Soltis D.E., Soltis P.S., Albert P.S., Oppenheimer D.G., Hong M., dePamphilis C.W., Frondlich C.W., Theissen G. 2002. Missing links: the genetic architecture of flower and floral diversification. Trends in Plant Science 7: 22–31.
Schneider E.L., Tucker S.C., Williamson P.S. 2003. Floral development in the Nymphaeales. International Journal of Plant Science 164: 279–292.
Timonin A.K. 2002. Sattler’s dynamic morphology: an acme or a reverie? Wulfenia 9: 9–18.
Uotilla P. 2000. Nymphaea L. In: Flora Nordica. Vol. 2. Stockholm: The Royal Swedish Academy of Sciences, 216–221.
Walker-Larsen J., Harder L.D. 2000. The evolution of staminodes in angiosperms: Patterns of stamen reduction, loss, and functional re-invention. American J. Bot. 87: 1367–1384.
Wilson P. 1992. On inferring hybridity from morphological intermediacy. Taxon 41: 11–23.